Hi everybody. Chrissy here, the Earthstompers’ statistics geek! I would like to share some of our business statistics for the calendar year 2019. I find these really interesting to understand where our clients come from, the distribution of online travel agents vs. more traditional booking methods, and how South African tourism is doing overall. So, here are some slides from my year end presentation:
Overall number of guests, Earthstompers scheduled garden route tours: (4, 5, and 6 Day Tours)
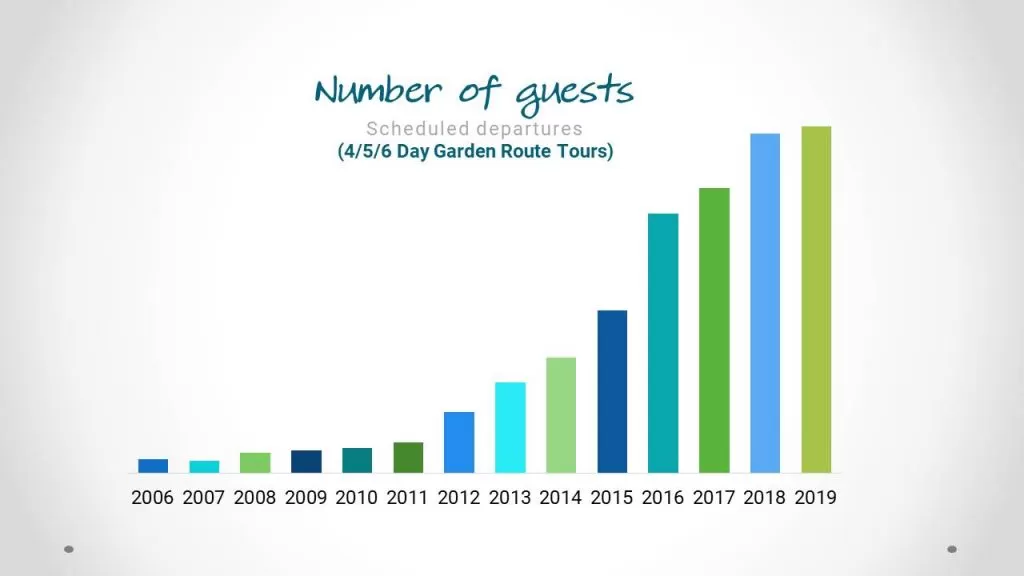
This is a chart we are very proud of, showing great growth in the fourteen years Earthstompers has been in business.
Number of guests by month
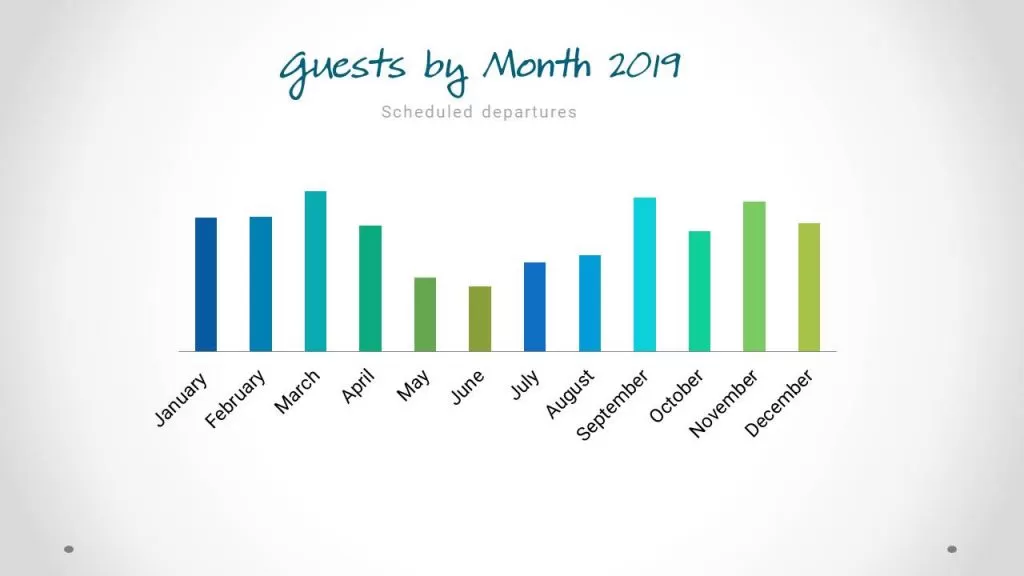
Our peak season tends to be from September – April, with lower numbers in winter (May, June, July.) August and April are “shoulder seasons”.
Overall business revenue
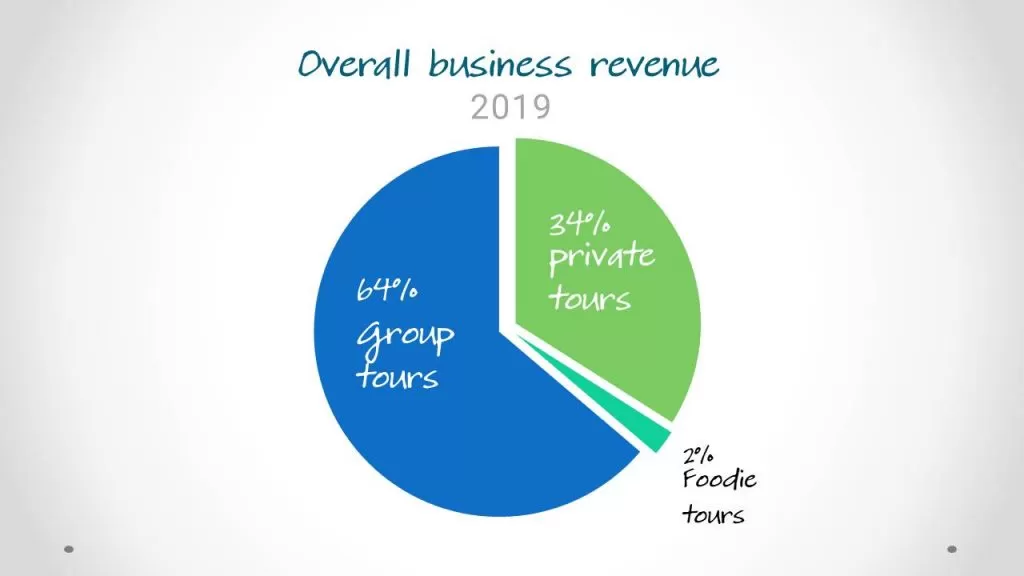
Many people think of our scheduled group tours when they think of Earthstompers, but a third of our overall business is private touring (university groups, families, honeymoons, etc.). And a small part of our business is Cape Food & Wine Tours, which we love!
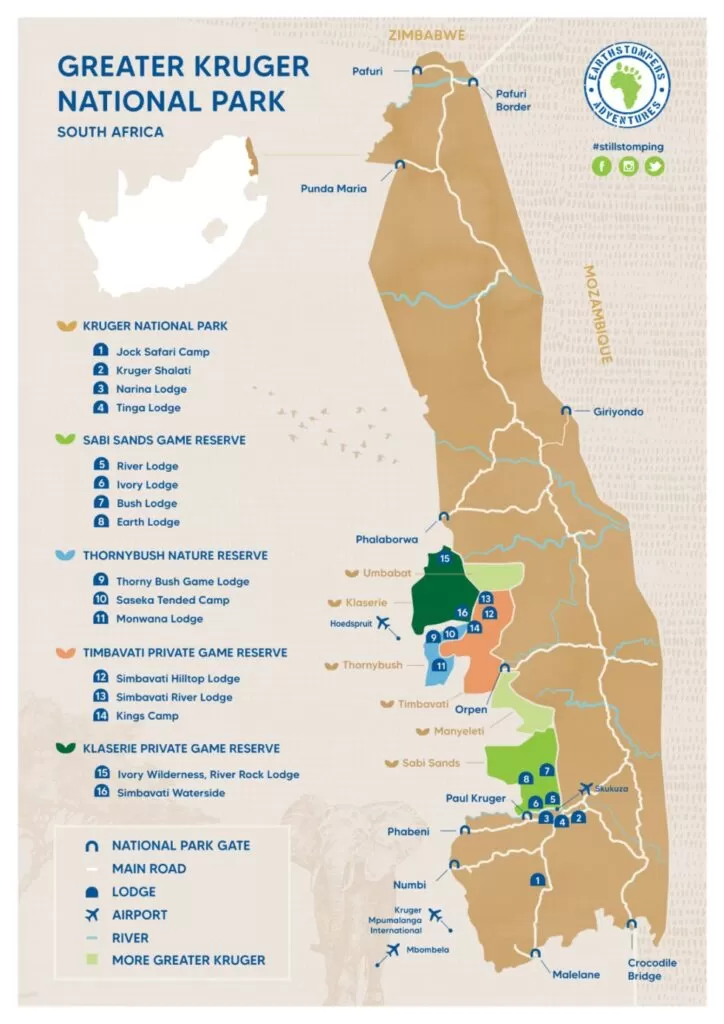
Nationality
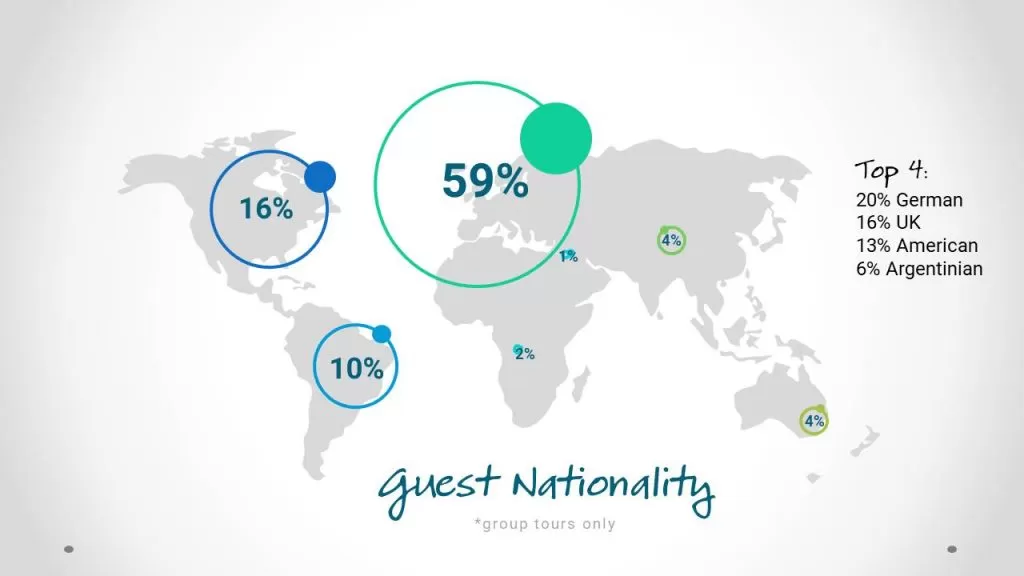
So, what countries do our guests come from? As you can see on the map, our largest market by far is Europe and the UK (lumped together in these statistics, sorry BREXIT-ers!). The second most significant region is North America, then South America, followed by a sprinkling of guests from the rest of the world.
Booking method
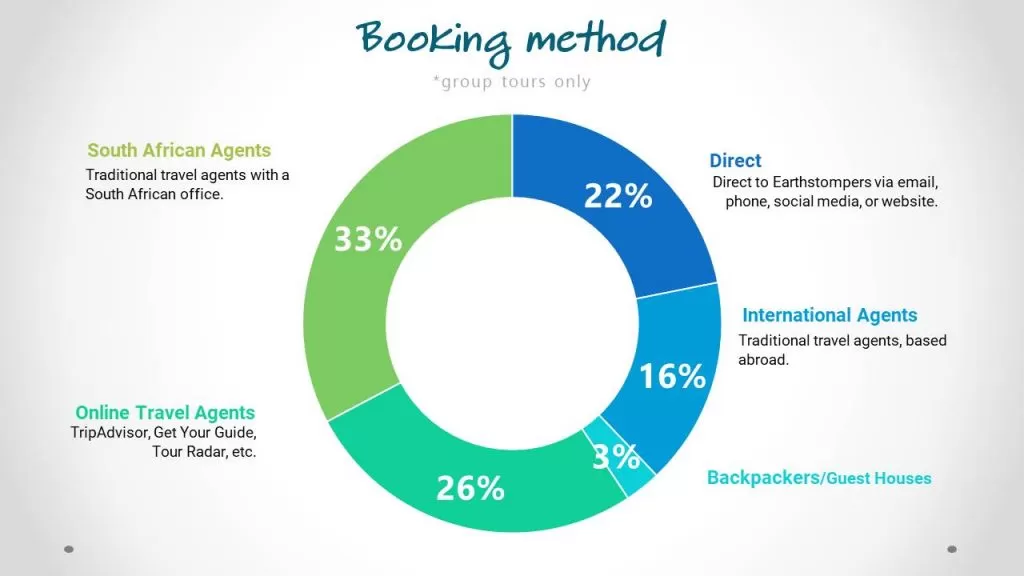
To my colleagues in the travel and tourism industry, this is probably the most interesting chart. How do people book Earthstompers tours? Still leading the way are traditional travel agents, with offices in South Africa. All of these agents offer tours online, but they have offices in South Africa. The next segment is online travel agents, with no walk-in booking offices, and the brands many will be familiar with – TripAdvisor, Get Your Guide, Tour Radar, and more. We are quite pleased that our direct booking percentage has hovered around 25% for many years. Next is international travel agents, with physical booking offices in Europe, Australia, the US, etc. Finally, a small booking percentage but one close to our hearts is local guest houses and backpackers in Cape Town who refer guests to us.
More than numbers
The above numbers only tell part of the story though. One of the things I’m most proud of as a small business owner is the creation of jobs . We directly employ 10 freelance tour guides and 7 office staff.
We indirectly support jobs across the Western and Eastern Cape such as the workers at our local car wash; our website designer and host; maintenance workers at Toyota; hospitality & catering staff at 12 different accommodation establishments; activities staff (bungee, skydive, canoeing, etc.); our accountants; office cleaners. In a country like South Africa with high unemployment, I am so grateful to be able to contribute to employment for so many people.
Here’s to a great 2020.
-Chrissy